Computing Similarity between Entities
Background
A common use case for ontologies is to compute Similarity between Entities, or between Terms, based on properties of the ontology. For example, when comparing two terms, we may want to score terms that are closer together in the ontology Graph as more similar. Other measures of similarity may be on frequency of usage of terms,
If Entities are annotated/associated with terms, we can also compute similarity between these based on the aggregate set of terms they are annotated with. The canonical use case for OAK here is Gene associations (e.g. to phenotypes, GO terms, anatomy or cell types for expression, etc), although any entities can be compared if ontology associations exist (e.g. comparing two people basic on shared music genres or favorite foods).
OAK provides various methods for computing similarity of terms and entities. These are currently focused on “classic” semantic similarity measures, such as Jaccard similarity and information-content based measures, but this may be extended in the future to support newer embedding-based methods.
Like all aspects of OAK, there is a separation between Interface and Implementation. The semantic similarity interface defines the API for computing similarity and related metrics. In theory there can be many implementations of this interface, in practice there is a default implementation and the semsimian implementation. See later in this document on for details.
Concepts
Jaccard Similarity
Jaccard similarity (Wikipedia) is a measure of similarity between two sets:
where \(A\) and \(B\) are sets.
For example given two sets {banana, apple, orange} and {apple, orange, pear}, the intersection of these
two sets is {apple, orange} (size 2) and the union is {banana, apple, orange, pear} (size 4). The Jaccard similarity
is therefore:
Jaccard Similarity of ontology terms
When applied to pairs of ontology Terms, the sets are typically the Reflexive Ancestors of the terms of interest. Like all OAK graph operations, the choice of Predicates used is important.
Phenotype ontologies typically compute this using SubClassOf links only
Ontologies such as GO, Uberon, and ENVO typically use SubClassOf and PartOf links
For example, given an ontology of vehicles with the following structure:
Car is-a Vehicle
Car has-part Engine is_a Part
Car has-part Wheel is_a Part
Car has-part Door is_a Part
Engine has-part Piston is_a Part
Car has-part Seat is_a Part
Bicycle is-a Vehicle
Bicycle has-part Wheel is_a Part
Bicycle has-part Handlebar is_a Part
Bicycle has-part Seat is_a Part
Visualized as:
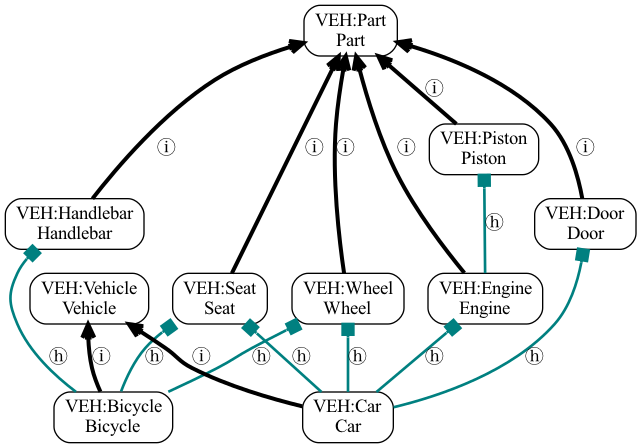
Vehicle ontology
If we follow predicates {is-a, has-part} (both of which are reflexive), then we have reflexive ancestors:
Car: {Car, Vehicle, Engine, Wheel, Door, Piston, Seat, Part}
Bicycle: {Bicycle, Vehicle, Wheel, Handlebar, Seat, Part}
Intersection: {Vehicle, Wheel, Seat, Part}
Union: {Car, Vehicle, Engine, Wheel, Door, Piston, Seat, Bicycle, Handlebar, Part}
The same ontology with the Most Recent Common Ancestor terms of Car and Bicycle highlighted:
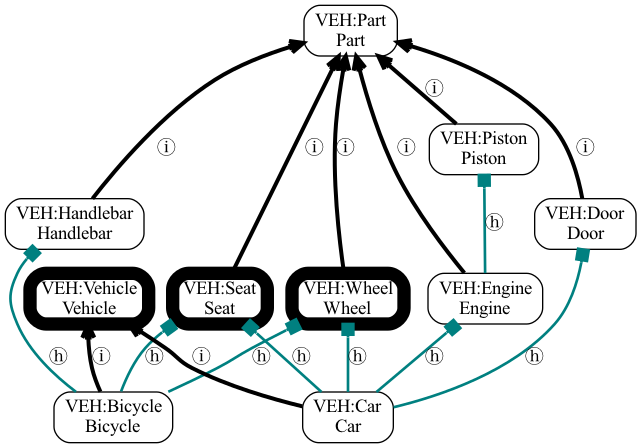
Vehicle ontology with MRCAs
Jaccard similarity between Car and Bicycle would be:
You can test this by running:
runoak -i simpleobo:tests/input/vehicles.obo similarity Car @ Bicycle
Information Content
Information Content (IC) is a measure of the specificity of a term. It is typically computed as the log of the inverse of the frequency of the term in a corpus:
where \(P(t)\) is the probability of the term in the corpus. There are two ways to compute this:
Using the ontology as the corpus
Using Associations between entities and terms as the corpus
In both cases the whole ontology Graph is used. This means that a Descendant term will always have IC that is equal to or greater than its Ancestor term (over some specified set of predicates).
When the ontology is used as the corpus, the probability of a term is computed as the number of descendants of a term (reflexive) divided by the total number of terms in the ontology:
You can see this via
runoak -i simpleobo:tests/input/vehicles.obo similarity Car @ Bicycle
When we consider all relationships, there are multiple MRCAs (see figure above). These are tied with an IC of 1.29.
When associations are used, the probability of a term is computed as the number of entities associated with a term (directly or indirectly) divided by the total number of entities:
where \(E(t)\) is the set of entities associated with \(t\) and \(E\) is the set of all entities.
To build a table of IC for all terms in HPO, using the ontology as the corpus:
runoak -i sqlite:obo:hp information-content -p i i^HP:
To include associations, use the --use-associations flag, in addition to
specifying the associations themselves:
runoak -g phenotype.hpoa -G hpoa -i sqlite:obo:hp information-content -p i --use-associations i^HP: -o hp.ics.tsv
Here we save to a file hp.ics.tsv
IC can be used to score the Most Recent Common Ancestor (MRCAs) of two terms; also known as Resnik similarity.
We can compare scores using native ontology ICs and ICs using annotations as a corpus
runoak -i sqlite:obo:hp similarity -p i HP:0000015 @ HP:0000017
Gives an IC of 9.02 for the MRCA of Bladder diverticulum and Nocturia.
subject_id: HP:0000015
subject_label: Bladder diverticulum
object_id: HP:0000017
object_label: Nocturia
ancestor_id: HP:0000014
ancestor_label: Abnormality of the bladder
ancestor_information_content: 9.020517017340513
jaccard_similarity: 0.6
phenodigm_score: 2.3264372354319613
We can plug in the association corpus based IC table using the --information-content-file option:
runoak -i sqlite:obo:hp similarity -p i --information-content-file hp.ics.tsv HP:0000015 @ HP:0000017
This will give a lower IC:
subject_id: HP:0000015
subject_label: Bladder diverticulum
object_id: HP:0000017
object_label: Nocturia
ancestor_id: HP:0000014
ancestor_label: Abnormality of the bladder
ancestor_information_content: 3.042673785507031
jaccard_similarity: 0.6
phenodigm_score: 1.3511492409442485
The higher IC for pure ontology corpus reflects a bias in depth in the ontology.
Ensemble Scoring of term pairs
We can compute ensemble scores by combining existing scores. For example, the Phenodigm score combines Jaccard similarity and Resnik similarity.
See the Phenodigm paper for details.
Other similarity measures
Other potential similarity measures include:
Phenologs
Embedding-based methods
KGE embeddings, e.g. GRAPE
Text embeddings, e.g. using OpenAI text-ada-002
Aggregate measures for comparing entities
Computing similarity between terms (classes) is relatively easy. But in general, users want to compare entities such as genes. Here we have two broad approaches:
Knowledge Graph (KG): treat the entities as nodes/terms in the graph and use the standard ontology methods above
Aggregate Statistics (e.g. Best Match Average)
With the KG approach the entities typically become leaf nodes in the graph, and we compare using standard graph methods where both association predicates (e.g. has-phenotype) and ontology predicates (e.g. is-a and part-of) are used.
The more common approach is to use aggregate statistics, which better accounts for incomplete annotation and annotation bias. Here we have two entities to compare e1 and e2, where each entity is the subject of association edges pointing to terms (sometimes called a profile). The goal is to compare the profiles using aggregate statistics. The aggregate statistics can be performed over any individual pairwise term statistics.
The simplest approach is to take the maximum pairwise similarity between terms in the two profiles; for the IC of the MRCA this would be:
However, this doesn’t take into account all the other associations for each entity.
A more common aggregate statistic is Best Match Average (BMA), which is the average of the maximum pairwise similarity between each term in the first profile and the second profile:
Currently this is the default used in OAK.
This is illustrated in this figure:

Aggregate statistics, from the Phenodigm paper.
To compare two profiles in OAK you can use the termset-similarity command, passing in each
profile, separated by @:
runoak -i sqlite:obo:mp termset-similarity \
   MP:0010771 MP:0002169 MP:0005391 MP:0005389 MP:0005367 @\
   MP:0010771 MP:0002169 MP:0005391 MP:0005389 MP:0005367
(note that like all OAK commands, any expression can be substituted as arguments, e.g. .idfile to
load the IDs from a file)
The result conforms to TermSetPairwiseSimilarity
This assumes that you have already done the lookup using an association table.
Note that in the above, the IC scores are calculated using only the ontology as corpus.
You can pass in a pre-generated IC table (e.g. if you computed this using a particular association database)
using the --information-content-file option.
Vector-based approaches
The methods above are formulated in terms of sets of ontology terms.
A term can also be conceived of as a vector. The simplest representation is a one-hot vector for each term, with a bit set for every ancestor of that term. Entities can also be conceived of as vectors of their profile and all ancestors of that profile.
With a vector representation, vector-based methods such as cosine similarity can be used, including cosine-similarity. These are typically faster to compute, and libraries such as numpy can be used to efficiently compute all-by-all similarities.
Typically one-hot encodings are long, if the ontology is large (one element per term). More recent methods make use of reduced dimensionality vectors. These might be computed from the graph (either pure ontology graph, or the KG formed by combining associations and ontology graph), or from textual descriptions of the terms using text embedding models.
Currently OAK does not support these reduced dimensionality vectors, for now you can use libraries such as
Implementations
Default Implementation
Currently the default implementation in OAK is in pure python, and may be slow for large ontologies or association databases.
Ubergraph
Ubergraph has ICs pre-computed, using multiple ontologies as a corpus.
Semsimian
Semsimian is a Rust implementation of semantic similarity. OAK is able to use this as an implementation, wrapping an existing implementation.
To wrap an existing adapter using semsimian, prefix the selector with semsimian:
For example:
runoak -i semsimian:sqlite:obo:hp similarity .all @ .all -O csv
Note that semsimian is under active development and performance characteristics may change.
Data Model
See the Similarity data model for details of the data model.
Companion Notebooks
See the notebook for the `termset-similarity Command <https://github.com/INCATools/ontology-access-kit/blob/main/docs/examples/Commands/TermsetSimilarity.ipynb`_
Further reading
Lord et al, Semantic similarity measures as tools for exploring the gene ontology https://pubmed.ncbi.nlm.nih.gov/12603061/
Koehler et al, Clinical diagnostics in human genetics with semantic similarity searches in ontologies, https://pubmed.ncbi.nlm.nih.gov/19800049/